Comparative financial statements definition
/What are Comparative Financial Statements?
Comparative financial statements are the complete set of financial statements that an entity issues, revealing information for more than one reporting period. The financial statements that may be included in this package are as follows:
The income statement (showing results for multiple periods)
The balance sheet (showing the financial position of the entity as of more than one balance sheet date)
The statement of cash flows (showing the cash flows for more than one period)
Another variation on the comparative concept is to report information for each of the 12 preceding months on a rolling basis.

Advantages of Comparative Financial Statements
Comparative financial statements are quite useful for the following reasons:
Supports trend analysis. Provides a comparison of an entity's financial performance over multiple periods, so that you can determine trends. The statements may also reveal unusual spikes in the reported information that can indicate the presence of accounting errors.
Supports proportional analysis. Provides a comparison of expenses to revenues and the proportions of various items on the balance sheet over multiple periods. This information can be useful for cost management purposes.
Supports extrapolations. May be useful for predicting future performance, though you should rely more on operational indicators and leading indicators than on historical performance for this type of analysis.
It is customary to issue comparative financial statements with additional columns containing the variance between periods, as well as the percentage change between periods.
The Securities and Exchange Commission requires that a publicly held company use comparative financial statements when reporting to the public on the Form 10-K and Form 10-Q.
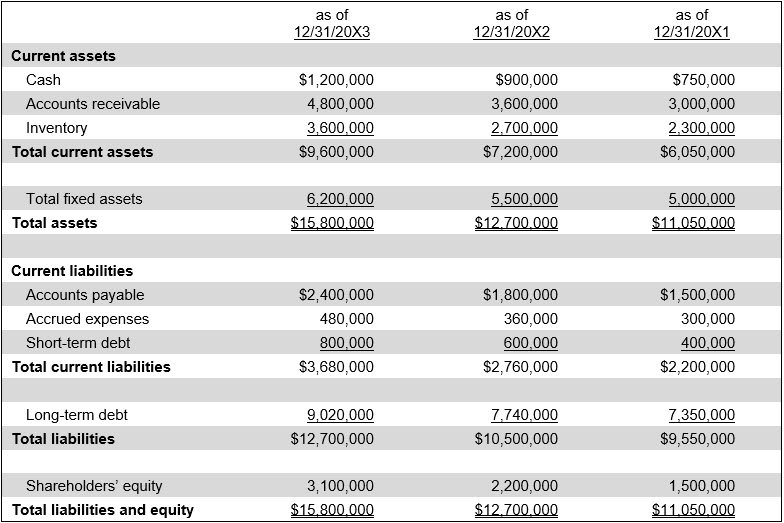
Example of Comparative Financial Statements
The following is an example of a balance sheet that is presented on a comparative basis.
ABC International
Balance Sheet
FAQs
Are Footnotes also Presented on a Comparative Basis?
Yes, footnotes are generally presented on a comparative basis when the information is relevant to multiple periods. Disclosures such as debt schedules, commitments, contingencies, and significant accounting policies often include both current and prior-period amounts. This ensures consistency between the statements and notes, giving users a clearer picture of year-over-year changes.
Related Articles
Common Size Financial Statements
Condensed Financial Statements
Consolidated Financial Statements