Cause and effect diagram definition
/What is a Cause and Effect Diagram?
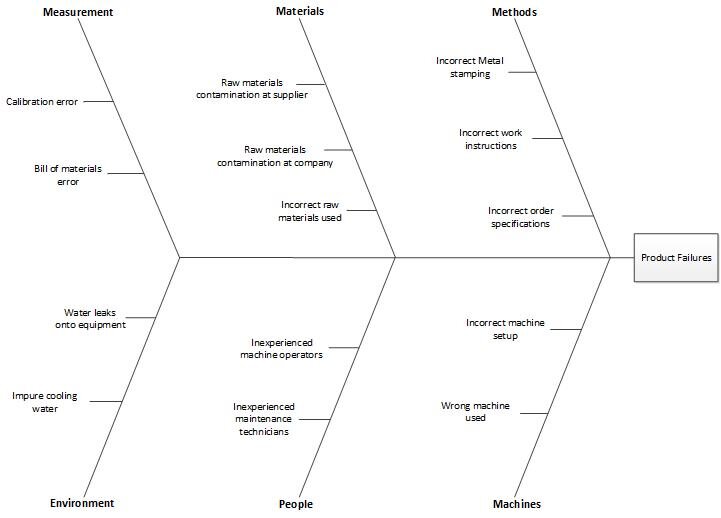
A cause-and-effect diagram is a visual layout of the possible causes of a problem. It is structured to show a number of branches, and so looks somewhat like a fish skeleton (hence its alternate name of fishbone diagram). The diagram begins with a single line, at the end of which is stated the problem to be solved. Then a number of branches are added that denote the general areas in which the causes of problems may be found. The generic headings most commonly used for these problem areas are methods (procedures), machines (equipment), people, materials, measurement, and environment.
Related AccountingTools Course
With this basic structure in place, a facilitator then collects possible causes from the team assigned to the problem, and writes them into the diagram. The outcome is a diagram similar to the following sample. This approach does a good job of organizing information about the causes of a problem.
Advantages of a Cause and Effect Diagram
Here are some of the advantages of using a cause-and-effect diagram:
Clear visualization of relationships. The diagram provides a visual structure that organizes potential causes into categories, making it easier to see relationships between the problem and its possible root causes. This visualization helps teams grasp the complexity of an issue and break it down into manageable parts.
Encourages a thorough analysis. A cause and effect diagram prompts users to think broadly and systematically about all possible causes, including factors they might otherwise overlook.
Identifies root causes. By exploring multiple layers of causes, the diagram aids in distinguishing between symptoms and underlying issues. This focus on root causes, rather than surface-level symptoms, enables teams to develop solutions that address the true source of the problem.
Promotes team collaboration. Creating a cause-and-effect diagram typically involves brainstorming, which encourages input from various team members. This collaborative approach brings in diverse perspectives, which can lead to more innovative and effective solutions.
Simple and easy to use. The format of the diagram is straightforward, making it accessible to all team members regardless of their technical background. Its simplicity makes it useful across various fields and for a range of problem-solving contexts, from production issues to service delivery challenges.
By using a cause-and-effect diagram, teams can better understand the underlying causes of a problem, develop effective solutions, and ultimately make informed, strategic decisions that lead to more sustainable improvements.
Disadvantages of a Cause and Effect Diagram
There are several disadvantages to the use of cause and effect diagrams. First, they can be exceedingly complex, making them difficult to read. Second, they display too many issues, resulting in project teams spreading their resources over too many solutions. And third, the brainstorming process used to create a cause and effect diagram can result in lots of irrelevant issues that should not be included in the diagram.
